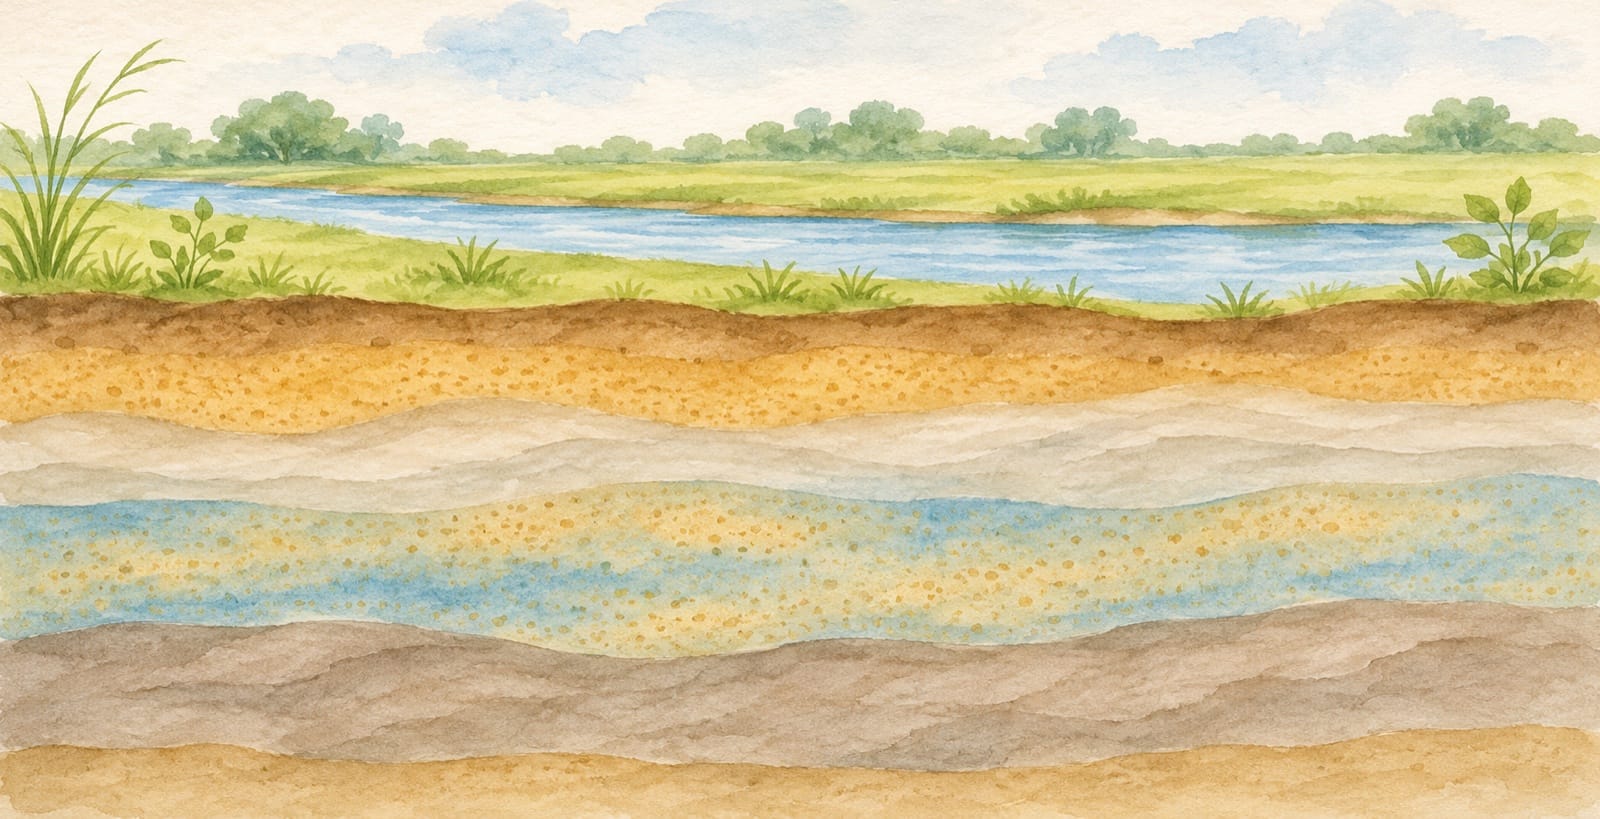
Ayodhya is easy to picture beside a river. Its groundwater asks you to imagine a second landscape: the material beneath the surface, and the spaces through which water can move. A map of that hidden landscape offers a different way to understand the district.
The Central Ground Water Board's Ayodhya aquifer-mapping report describes layers of clay, silt, calcrete, locally called kankar, and different grades of sand. Fine sand to silty sand forms the principal aquifers it identifies. Start there, with the material, before looking for a number that seems to summarise the whole district.
Water between grains, rather than an underground lake
An aquifer is water-bearing material that can transmit water to wells or springs. The U.S. Geological Survey's groundwater explanation describes water occupying spaces and cracks in soil and rock. Those spaces, and how they connect, help determine how water moves.
This is a useful change of scale. From the riverbank you see a broad surface of water. Underground, the picture can involve very small openings between particles. The word “aquifer” does not require you to imagine a cavern filled with a blue lake.
Try reading a geological section with two questions in mind: what material is shown, and how does it differ from the material beside it? Give the legend as much attention as the colours. A blue area in one illustration may mean something different from blue on another map.
Read the district as a layered landscape
The CGWB report places Ayodhya district within the central Ganga plain and describes its underlying alluvial deposits. Its geology section distinguishes older and younger alluvium. That gives the district another kind of history to consider: the deposits beneath today's roads, fields and settlements.
You do not need to learn every technical term in one sitting. Begin with the report's geology section, on printed page 8, then look back at the map above it. Notice that a district outline contains several mapped categories. An administrative boundary helps organise information; it does not make everything within it physically identical.
That is why the map rewards a slower look. Follow one boundary between categories. Find a river line and compare it with the surrounding mapped areas. These are reading exercises, not a way to identify conditions beneath an individual building.
Ask when a measurement was made
The report's district summary labels its pre-monsoon water-level observations May 2021 and its post-monsoon observations November 2021. Those dates belong with the measurements. They are not a live reading of a well in 2026.
Before comparing two figures, write down their dates, locations and units. Check whether each represents a single observation, a range or a district summary. A difference can be worth investigating without immediately becoming a story of permanent decline or recovery.
USGS explains that groundwater levels can change with precipitation and pumping, among other influences. A map and a measurement answer related questions, but they are not interchangeable: one helps describe the setting, while the other records a condition at a particular time.
Three questions to keep beside the map
A simple reading note can have three lines:
- What is shown? Name the map, section or table and read its legend.
- Where and when? Keep the study area and observation period attached to the information.
- What remains unknown? Separate what the source establishes from what would require a fresh local investigation.
This approach leaves room for curiosity without asking an old report to answer every present-day question. It cannot establish a property's water supply, the result of a current water-quality test or permission to drill a well. Those are separate, site-specific matters.
For another view of the city's water systems, read where wastewater goes behind Ayodhya's riverfront. Together, the two subjects invite a broader view of a river city: what is visible beside the water, what is built to manage it, and what lies beneath the ground.
Sources checked on 6 November 2026. The local report includes historical observations; this article does not report current groundwater levels or establish drinking-water safety.
AI-generated conceptual illustration of a river plain and imagined sediment layers. Not an Ayodhya location, surveyed geological section or engineering diagram; colours and layer thicknesses are illustrative. Resized and JPEG-compressed for display.